kdpeaks
kdpeaks is an R library for finding peaks in KDE density plots. If you pass the function a kernel density estimate matrix, the function will find all of the peak values in the 2D matrix.
Installation
This package can be installed directly from the Github repository.
library(devtools)
install_github("mbreese/kdpeaks")
Method
kdpeaks works using a variant of an sequencing alignment dynamic programming algorithm.
Steps:
-
For each point in the matrix, find the highest value in all adjacent cells (including itself).
 1  |  2  |  3
 4  | (5) |  6
 7  |  8  |  9
In this case, if we are looking at cell #5, we'd determine the maximum value between all nine of these cells. This step is repeated for all cells in the matrix. This generated a "flow matrix" indicating the direction of the maxima.
-
Peaks are identified as the cells where that are their own maxima. In the above example, if 5 is the highest peak of the adjacent cells, then 5 is it's own maxima. Each position in the matrix is then assigned to a peak based on the flow. Peaks that are adjacent to other peaks (within a set radius) are merged.
-
Peaks are sorted in their order of magnitude (their height).
-
The top peaks are calculated based on the mean and standard deviation of the peak heights.
Data from all peaks are returned from the function, sorted by their height.
Example
Here is an example KDE plot for a log2-ratio vs BAF data in whole-genome sequencing.
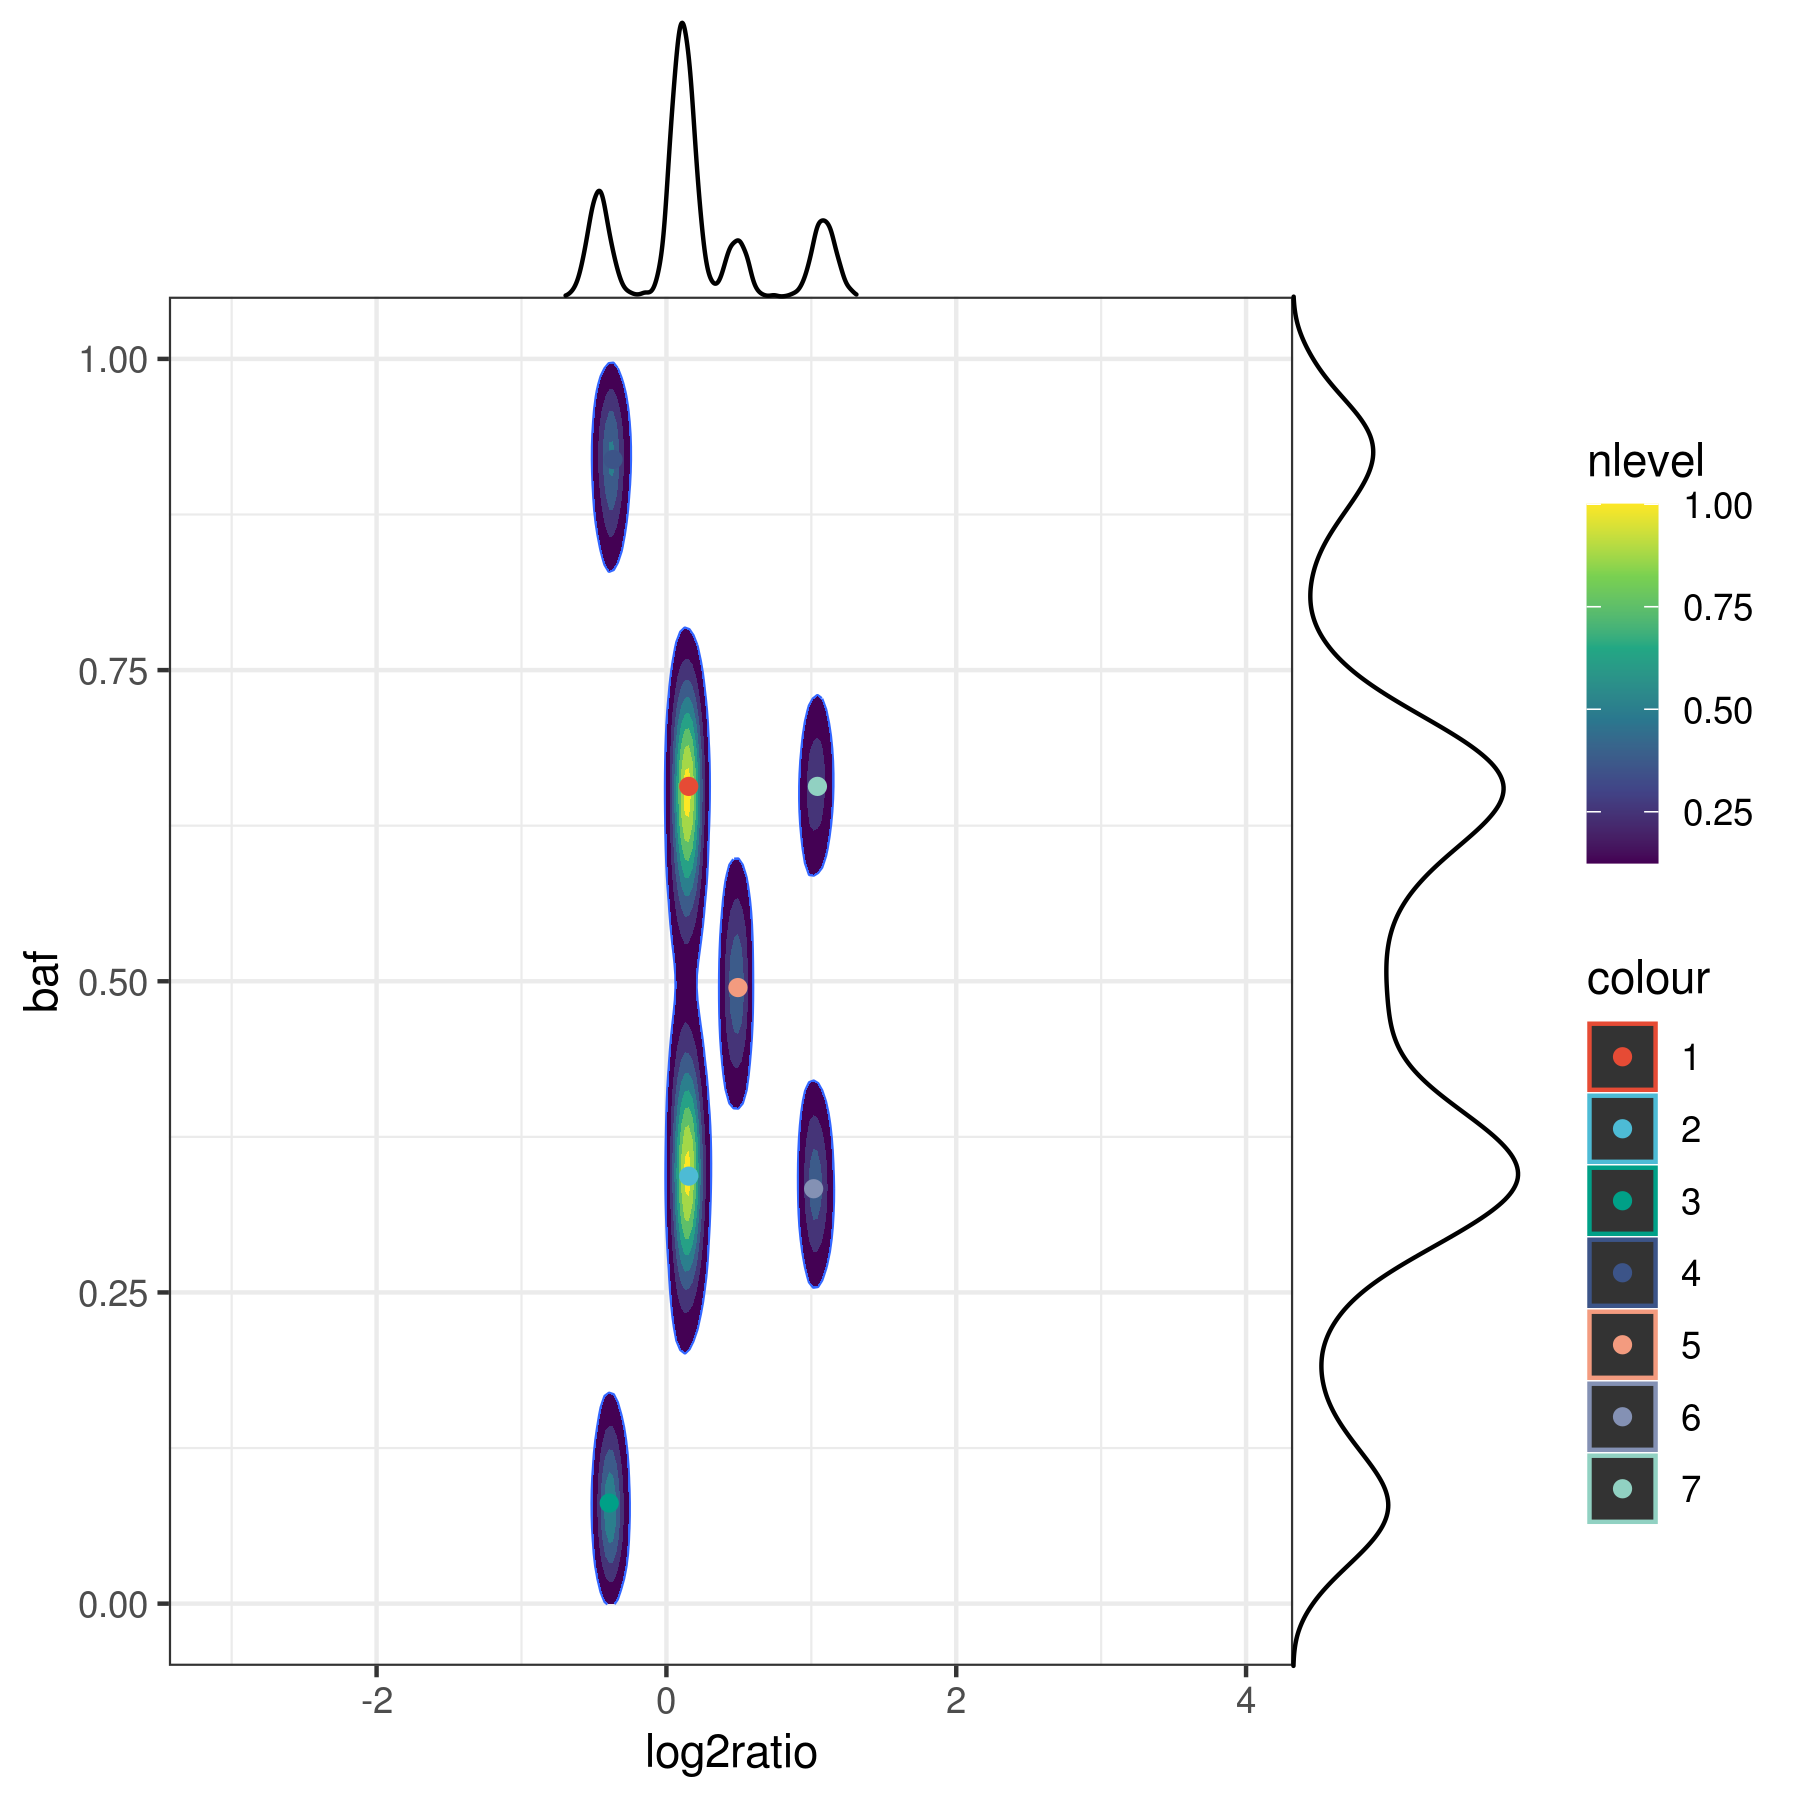
kdpeaks was used to find the peaks as identified by the 7 points. 1-D density plots are shown for each axis as a comparison.
Here is how this plot was generated.
k <- kde2d(chr1.df$log2ratio, chr1.df$baf, n = 100)

peaks<-find_peaks(k, combine_within = 5)

peaks.df <- data.frame(x=peaks$x[1:peaks$top_peaks], y=peaks$y[1:peaks$top_peaks], n=as.factor(peaks$num[1:peaks$top_peaks]))
The x/y coordinates of all peaks is returned as peaks$x and peaks$y. The number of top peaks is returned in peaks$top_peaks (given the z-score, 1.65 by default). The height of the peaks is given in peaks$z. The area that each peak contains is given in peak$size. The flow matrix is returned as peak$peak.m.